As someone who is furiously looking to add to my stack, I’m often thinking about how I can do this better. There are already multiple ways to acquire Bitcoin which we have covered in various sections of The Bitcoin Manual such as mining, gaming, value for value earning and buying it.
In this article, I want to dive a little deeper in to the “buying” strategy side of things. There are a couple of techniques plebs use such as turning on auto-buying with the “Dollar Cost Average” approach, which people also refer to as saving their hard earned fiat in Bitcoin.
Then there’s the setting up of buy orders on exchanges so that you can catch any sudden price drops during a crash.
But how do you know where to set those buy orders on the exchanges? What price is best to try and catch those wicks down? When will there be another drop in price?
One of the models that I’ve been loosely following over the last year or so to help answer these questions has been the Wyckoff model, which was a bit of an eye-opener once I learned a little about it.
I first saw this on a YouTube channel called “Uncomplicated” who shared a video about the Wyckoff Method playing out about a month before the crash in May 2021. Then suddenly everyone became an expert overnight and posted about it left, right and centre!
That’s not to say this is infallible as all models have their limitations, and I’m not someone who’s trading back and forth regularly as technical analysis and moving averages are way over my head. I just place buy orders based on a best estimate in a certain price range.
However, it’s another item to add to the toolbox so do with it what you will. Let’s first find out how the Wyckoff Method came to be.
Who Is Richard Wyckoff?
Richard Wyckoff is the man who is behind the Wyckoff Method and he was a technician/analyst working in Wall Street, back in the early 20th century, with some of the big investment firms such as JP Morgan and Charles Dow.
He studied and wrote about financial markets and noticed distinct patterns that occurred during disruptive periods.
Most retail traders use the same tools and analytical techniques to determine where to place their buy and sell orders for commodities and stocks, which made easy pickings for huge institutions who could easily scare retail out of their positions by manipulating the prices of them.
To help explain this, he proposed that all the manipulation was done by a single entity referred to as the “Composite Man” who will wreck you if you don’t understand his moves but you can take advantage if you do, or words to that effect.
Composite Man Traits
That’s not to say that every big institution is out to get you and manipulates prices on a whim (although it’s easy to understand why this is the default way of thinking).
Instead, the big players are looking at indicators on technical analysis such as price zones of “support” and “resistance” and how much trading activity there is around these zones from people who want to buy and sell.
This is where you see all those liquidations and sudden price movements in Bitcoin as greedy degen traders that take out excessive leverage (using their Bitcoin as collateral to take out a loan to make a bet on price) get rekt. Big players will manipulate the price around those zones to get some cheap Bitcoin.
Let me give you an example of how this works.
A bunch of degen traders have set up multiple 100x leverage positions to go short on Bitcoin when the price drops under $30k. The big players will manipulate the price to push past that price point and then quickly back up again, which liquidates the leveraged positions and gives the whales cheap BTC.
Is Bitcoin Going To Zero?
When these big liquidation events occur, that’s when you’ll see a lot of FUD going around claiming that Bitcoin is going to zero with some boring reasons as to why that’s the case.
In fact, the big money players aka “smart money” do not want the asset they play around in to go to zero as they want to get all the retail money they can at that moment. This means that more retail money will be brought in later as people FOMO back in to their benefit in a classic Composite Man play.
The aim for the big players is to keep milking the retail cash cow for as long as possible so it’s in their interest not drop the asset price to zero and make it crash too much.
It turns out that moving price up or down through zones of support or resistance requires a lot of money and Wyckoff noted there were distinct patterns which marked the arrival of institutional plays.
Different Phases Of The Wyckoff Method
Although this article isn’t intending to go too much in to technical analysis side of things (you can find information on this elsewhere), there are four main phases to be aware of that have appeared in every financial market since they were discovered:
- Accumulation – where the big players try to accumulate as much Bitcoin as possible while retail is reeling with fear after a crash.
- Distribution – big players try to sell as much Bitcoin as possible to retail while new FOMO money comes in from interested retail but they manipulate the price to keep them interested.
- Re-accumulation (mark-up)– big players pause the uptrend and cause a boring “crab market” to dissuade retail from getting in. Retail will subsequently look for assets that have more price movement and the big players will still accumulate at this point.
- Re-distribution (mark-down) – big players will begin a volatile downtrend that sees liquidations, crashes and bear market type price movements
From my interpretation of these phases, I’ve looked back on the BTC/USD chart from the end of 2020 to May 2022 (at time of writing) and labeled where I think they are on the chart. Bear in mind, I’m not a professional and I could be wrong. As always do your own research and come to your own conclusions.
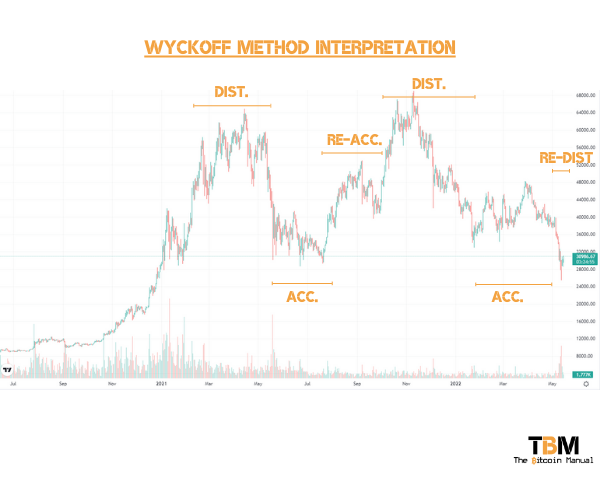
Using my interpretations, we’ve seen all 4 phases at some point between 2020-2022. We may be in a re-distribution phase now as the price is testing the potential support level of $30k but I’d be guessing at this point and not each Wyckoff phase appears the same on the charts – i.e. there’s subtle differences between each one.
Each of the four phases mentioned above has their own distinct sections to it but the re-distribution and re-accumulation phases are not always certain in the present moment. These phases are often elongated and can last for many months.
If you wanted to dive deeper in to the re-accumulation and re-distribution phases then I have put some extra learning resources at the bottom of this article for you to peruse at your leisure.
“Accumulation” and “Distribution” are a little more apparent though and we can zoom in a bit more on what’s involved in these phases.
Accumulation Pattern
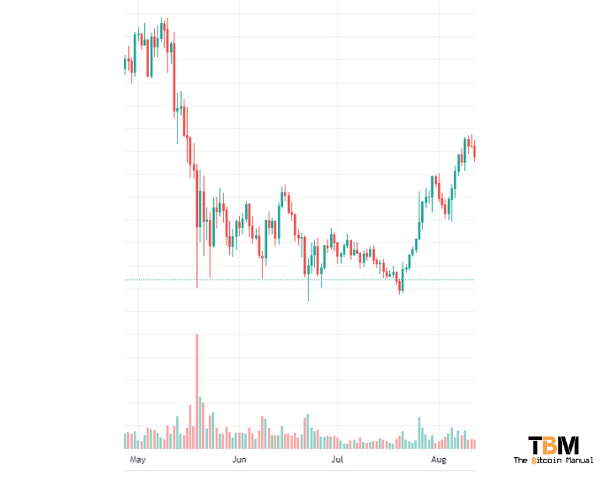
Zooming in on the chart above to the first accumulation pattern between May and August 2021 will reveal something similar to the theoretical model shown below.
These accumulation patterns usually happen when there is a lot of fear in the markets so I normally expect a few months in this phase as the big players scoop up all the cheap sats flying around so why not join them in the process?
As mentioned, not every accumulation and distribution will be exactly the same but the characteristics will be similar.
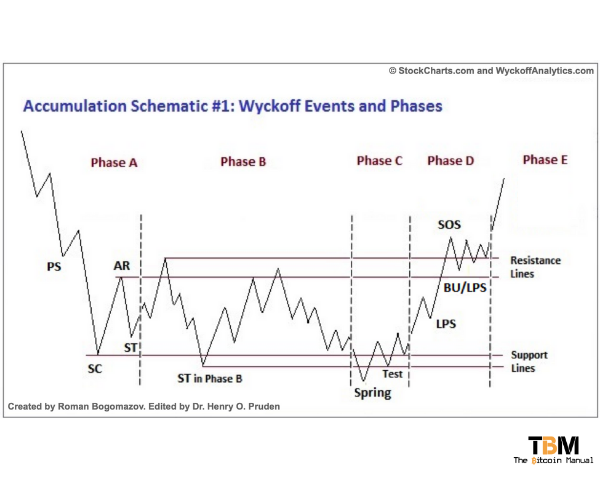
It’s a very busy diagram with a few acronyms on which represent different phases of accumulation but they are expanded upon below. These won’t be a perfect fit if you overlay the theoretical pattern on to a price chart but oftentimes will be pretty close:
- Phase A: Preliminary Support (PS) – a brief reprieve on a downtrend (usually the first halt after the end of a distribution)
- Phase A: Selling Climax (SC) – a price that’s low enough causing spooked retail investors to sell (i.e. weak hands)
- Phase A: Automatic Rally (AR) – an instant rebound from the SC as selling pressure has gone and smaller buying volume easily moves the price back up again
- Phase A: Secondary Test (ST) – the price drops again to test the supply and demand balance at this level
- Phase B: ST – Prices move sideways in this region between the AR and ST although sometimes go above/below the range to keep retail unsure about getting involved in the market.
- Phase C: Spring – a downward manipulation of price to continue to spook retail and a chance for big players to scoop up more cheap sats that they didn’t manage to get earlier on.
- Phase D: Last Point of Support (LPS) – prices start to move up again and will correct down again to the LPS but with much lower sell volume
- Phase D: Sign of Strength (SOS) – the price moves up again above the resistance lines with more buying volume, ready to exit the accumulation in phase E.
See if you can spot these different phases in the zoomed in chart below from May-August 2021 – it really is uncanny! The buying and selling volume is indicated at the bottom of the chart in green and red bars respectively:
Distribution Pattern
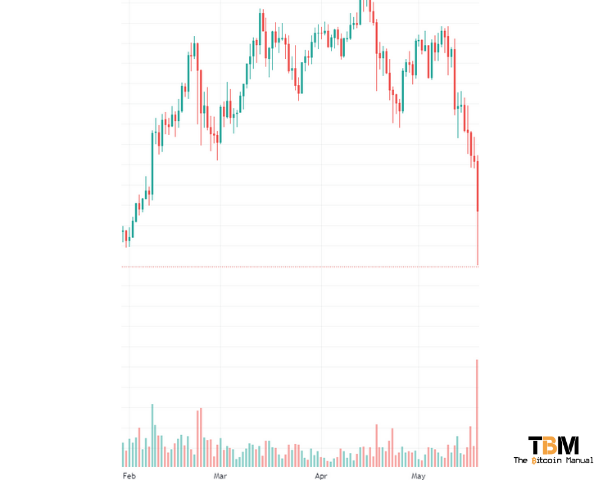
As for the distribution pattern, we’ll zoom in to the 3 month time period from Feb 2021 to May 2021. The Bitcoin price had gone on a meteoric rise from just under $12,000 up to a high of about $65,000 at the peak, so the big players were toying with retail to get the best price to sell at.

As you can see, the shape of the distribution pattern seems like an upside-down accumulation pattern but there are some subtle differences. The beginning of the distribution happens at the end of Phase E from accumulation:
- Phase A: Preliminary Supply (PSY) – this is where some retail traders would start to sell and take profits but there’s relatively low selling volume.
- Phase A: Buying Climax (BC) – new, inexperienced investors FOMO in to the hype (such as news articles and more mainstream coverage) and bump the price up
- Phase A: Automatic Reaction (AR) – this is where the big players start selling and bring the price to what will be the lower end of the price range of this particular distribution phase
- Phase B: Secondary Test (ST) – the big players stop selling and let the price come back up to just below the BC to set the upper end of the price range for the distribution phase.
- Phase B: Sign of Weakness (SOW) & Upthrust (UT) – big players will sometimes go above the price range to keep retail interested (UT) whilst they sell off their assets to them.
- Phase C: Upthrust After Distribution (UTAD) – designed to create pure FOMO for retail as the price is pushed past the price range from phase B, allowing big players to sell the rest of their bags and causing the price to fall
- Phase D: Last Point of Supply (LPSY) & Sign of Weakness (SOW) – Prices continue to fall before a brief respite at the LPSY and then the SOW which is below the price range set by the AR at the beginning of the distribution phase
- Phase E – marks the end of the distribution and generally, the beginning of another accumulation, although extended periods of accumulation or distribution may occur (known as re-accumulation or re-distribution)
See if you can spot the similarities from the theoretical chart above to the actual price chart underneath from Feb-May 2021:
How I Use The Wyckoff Method
I’m not a trader so I don’t use the Wyckoff on a day to day basis but as I’m trying to increase my stack, I like to understand how the big players operate as it’s pretty obvious in my mind that they have arrived and are toying with the price.
When we’re in a sudden down turn, i.e. accumulation phase, finding the range at which the price is likely to fluctuate between allows me to set some buy orders at the lower end and hopefully catch some really nice deals.
If we then come out of the accumulation phase and the price sky rockets, I change my strategy a little so I’m not getting sats at a bad exchange rate from fiat. I got suckered in to the FOMO in 2017, I know what it’s like.
It’s not a fool-proof strategy as I have missed a couple of times with my buy orders (one missed by $0.01, I was gutted lol) and there are many macro effects at play here with the global situation. Add to that, black swan events of shitcoins collapsing and having to dump all their holdings, meaning there will always be some degrees of error to contend with.
However, as I’m stacking for generations to come, I want to make sure I am doing what I can from Wyckoff’s Method and benefit from the Composite Man’s game plan.
How about you? Have you come across the Wyckoff Method or do you just buy Bitcoin at whatever the price? Let us know in the comments below!
Additional Resources: