Bitcoin might have introduced us to digital scarcity, but what isn’t scarce is the number of charts circulating the internet all about Bitcoin. These charts are used to stir up social media engagement to drive bullish or bearish sentiment in the market, and they do work.
Have a look at some of the Bitcoin chartists and on-chain analytics bros who built their massive social media following posting charts for the last eight years, and you’ll get some idea of what we’re talking about.
Navigating Bitcoin can be vast and complex, but understanding it becomes much more manageable when we look at the right charts. These visual tools not only track Bitcoin’s performance but also offer insights into its future trajectory.
To give you a jumping-off point, we’ll explore some of the most important charts in the Bitcoin universe, including the Rainbow Chart, S2F model, hash rate, and more.
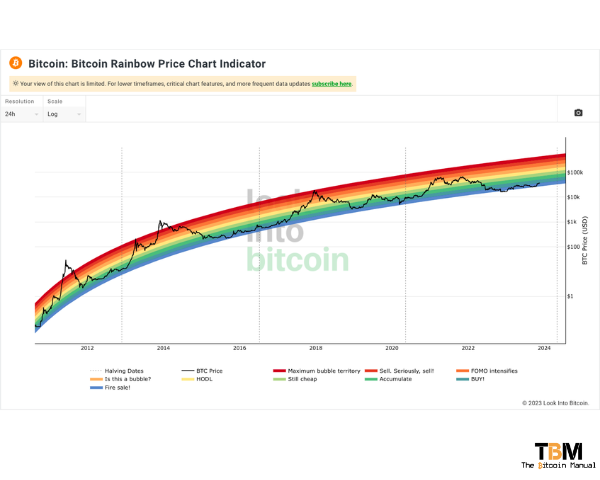
1. The Bitcoin Rainbow Chart
The Rainbow Chart is not just colorful but also highly informative. It’s based on a logarithmic regression, but unlike typical financial charts, it incorporates color-coded bands that indicate whether Bitcoin is undervalued or in bubble territory. This chart has a history of accurately signaling buying and selling opportunities and is a favorite among long-term investors.
2. Stock-to-Flow (S2F)
Developed by PlanB, the S2F model predicts Bitcoin’s price based on its scarcity, defined by the ratio of existing supply (stock) to the production rate (flow). These models underline Bitcoin’s potential as ‘digital gold’.
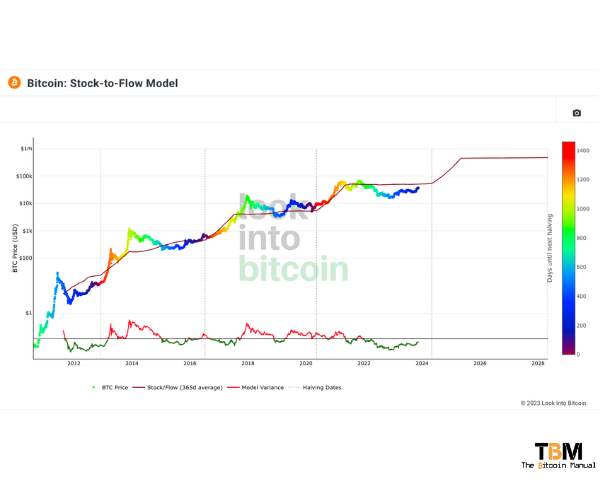
Note: If you’re not a fan of the S2F model, check out – The Bitcoin S2F Model Was A Marketing Gimmick
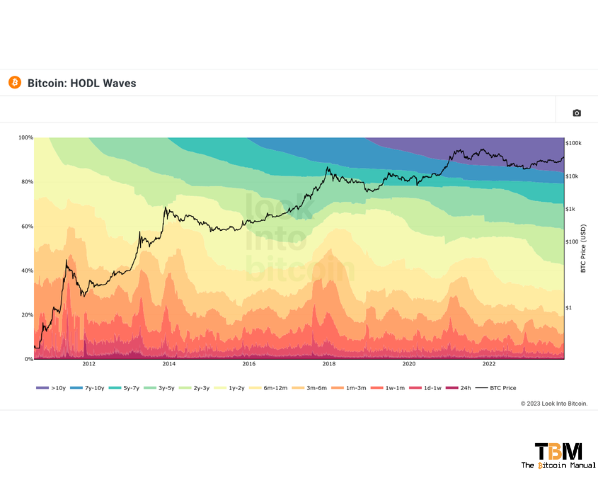
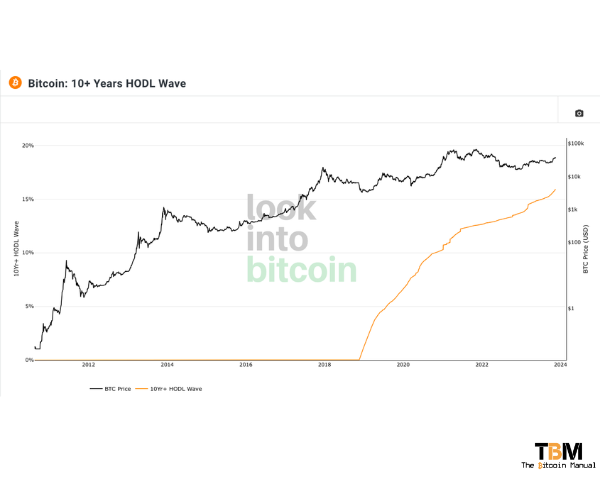
3. Hodl waves chart
This chart showcases the age distribution of all Bitcoin in circulation. It’s a fascinating way to understand investor behavior, particularly during different market phases. Long-term holding trends are visible, highlighting the growing confidence in Bitcoin as a store of value.
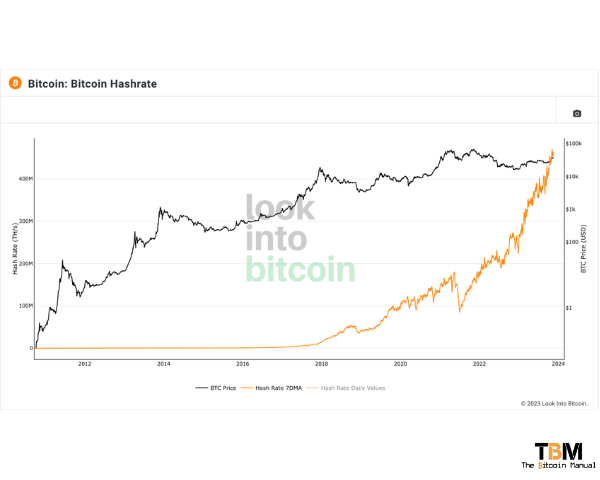
4. Hashrate chart
Hashrate represents the security and robustness of the Bitcoin network. It shows the total computational power used to process transactions and mine new Bitcoin. A rising hash rate indicates a healthy and growing network, reassuring investors of its stability.
5. Time since last moved charts
An intriguing way to gauge market sentiment, these charts track the various durations since bitcoins last moved between addresses. The popular intervals to compare are 1-year, 5-year and 10-year holding patterns, and from them, you can discern if the marginal Bitcoin user is willing to hold their position or they are trying to sell.
The longer periods typically suggest holding behavior, implying a bullish sentiment among investors.
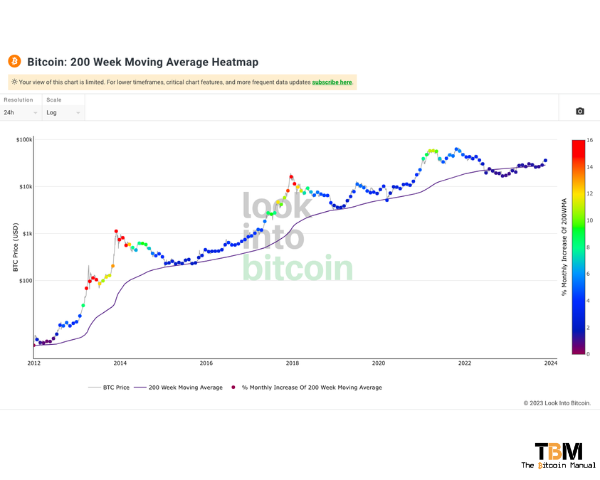
6. 200-Day moving average
A classic in financial analysis, the 200-day moving average for Bitcoin offers a clear view of its long-term trend. It’s particularly useful for identifying overarching market trends and potential reversals.
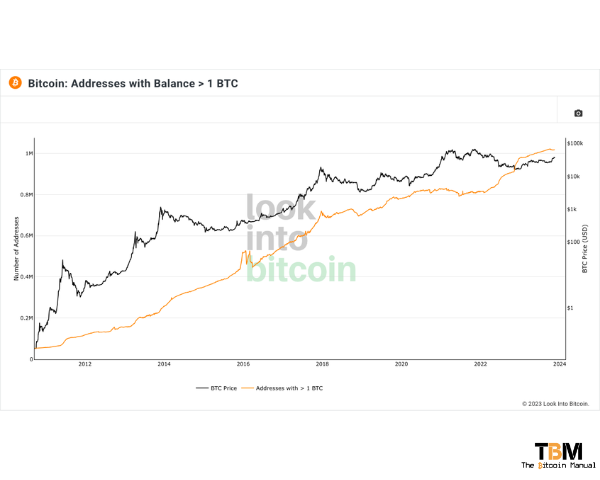
7. Addresses holding more than 1 BTC
Reflecting on Bitcoin’s distribution, this chart indicates how many addresses hold more than 1 BTC. It’s a measure of wealth distribution within the Bitcoin ecosystem and helps gauge the decentralization of Bitcoin ownership.
Charts are their own art.
Each of these charts offers a unique and insightful perspective into the Bitcoin ecosystem. They reveal key aspects of its performance, trends, and investor behavior.
However, it is crucial to remember that for the vast majority of people, the best strategy might simply be to buy and hold Bitcoin. This approach, avoiding selling bitcoin for fiat currencies, aligns well with Bitcoin’s philosophy of long-term value growth and financial freedom.
The most compelling takeaway from these charts is the unmistakable evidence of Bitcoin’s resilience and strength, growing more robust with each passing cycle. This trend not only underscores the wisdom of a ‘hodl’ strategy but also highlights Bitcoin’s potential as a transformative financial asset, consistently maturing in a global economic landscape.
Why sell a truly scarce asset for any asset that can be printed at will by politicians?