
Red Candle

When you look at Bitcoin price charts (probably every couple of minutes if you’re anything like us), then you will see red and green candles on the price charts.

These candles show price movements of Bitcoin over a specified time period, depending on what time you select when viewing these charts. It can vary from 1 hour to 1 month and beyond. 

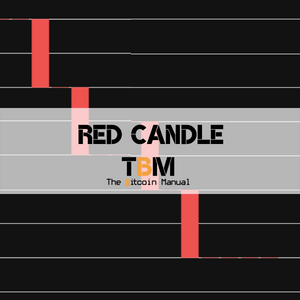
A red candle shows a decrease in price in the time period you specified when opening your price chart. These are also affectionately known as “red dildos” in the Bitcoin community, which means the same thing.

People on Twitter refer to a red candle when there’s a sudden price drop and encourage folks to buy the dip. A prolonged period of red candles could indicate a bear market.

Latest Articles

ArkPool Explained

What Is ArkPool?

Since Bitcoin mining is now an industrial-level operation, with the vast majority of hash rate coming from large-scale operations, it’s natural that the ecosystem and

Read More »
Arkade Bitcoin Explained

What Is Arkade?

Bitcoin’s base layer is deliberately conservative. It settles value securely, but it doesn’t offer instant payments, easy asset issuance, or flexible contracts. For years, the

Read More »
Hack or be hacked

Hack or Be Hacked

In September 2026, Chainalysis confirmed what we all knew when it published a figure that should have been front-page news across every crypto publication. Instances

Read More »
Cookie policy
We use our own and third party cookies to allow us to understand how the site is used and to support our marketing campaigns.