
Red Candle
Home » Bitcoin Culture » BTC Glossary » Red Candle
When you look at Bitcoin price charts (probably every couple of minutes if you’re anything like us), then you will see red and green candles on the price charts.
These candles show price movements of Bitcoin over a specified time period, depending on what time you select when viewing these charts. It can vary from 1 hour to 1 month and beyond.
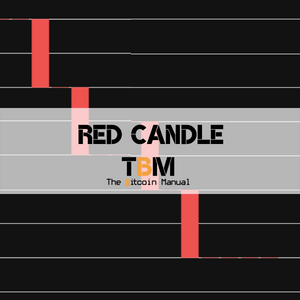
A red candle shows a decrease in price in the time period you specified when opening your price chart. These are also affectionately known as “red dildos” in the Bitcoin community, which means the same thing.
People on Twitter refer to a red candle when there’s a sudden price drop and encourage folks to buy the dip. A prolonged period of red candles could indicate a bear market.
Latest Articles

Beware Of BIP110/Blake BTC Scams
If you own Bitcoin, you should be aware of chatter over the last few weeks about “BIP110,” “Blake2b,” and a potential chain that will split

What Is Bitcoin Purity?
Bitcoin Purity is the latest, and arguably strangest, offshoot of the BIP 110 saga. Where the BLAKE2b hard fork responded to BIP 110’s failed soft

Bug Found In BitBox Hardware Wallet
On August 17, 2026, Swiss hardware wallet maker BitBox disclosed and patched two “severe” vulnerabilities in its BitBox02 and BitBox02 Nova devices, alongside a previously